
We distributed the eigensolves in quarter-power EMA-Gram across TPUs to shorten training runs. In a single-seed comparison on the 447M-parameter Delphi recipe, mean training update time fell from 38.75 seconds in the replicated run on four TPU v4 devices to 3.70 seconds in the matrix-sharded run on sixteen. C4 English loss was close at the shared evaluation, while Penn Treebank loss was higher. We adopted the matrix layout as the working baseline for the training sweep after this 924-update comparison, which measured the layout and TPU mesh changes together.
Marin issue #10784 · Logbook issue #20
Background
For each linear weight, EMA-Gram keeps two exponential moving averages of gradient products. The left Gram averages the gradient matrix times its transpose. The right Gram averages the product in the reverse order. The two Grams track relationships among rows and among columns of the gradient. At each update the optimizer rescales the Grams and uses their inverse quarter powers to shape the direction of the weight update. To get those powers, it decomposes each full Gram into eigenvectors and eigenvalues, adds a small regularizer to the eigenvalues, raises them to −1/4, and reconstructs the matrix.
Computing the spectral powers took 20.26 seconds at the median in an optimizer diagnostic on TPU v5e. That timing covers normalization, eigendecomposition, and reconstruction. The full quarter-power optimizer update took 20.84 seconds in the same diagnostic.
Approach
With the replicated layout, each device solves the same set of Gram matrices. The matrix layout uses the fact that each solve needs only one layer’s Gram. Take the left Grams from two layers. One TPU gets the entire first Gram, and a second TPU gets the entire second Gram. They solve the two matrices in parallel, then gather the eigenvalues and eigenvectors. Each TPU normalizes the input Grams before the solves and reconstructs the full powers after the gather. The right Grams follow the same path.
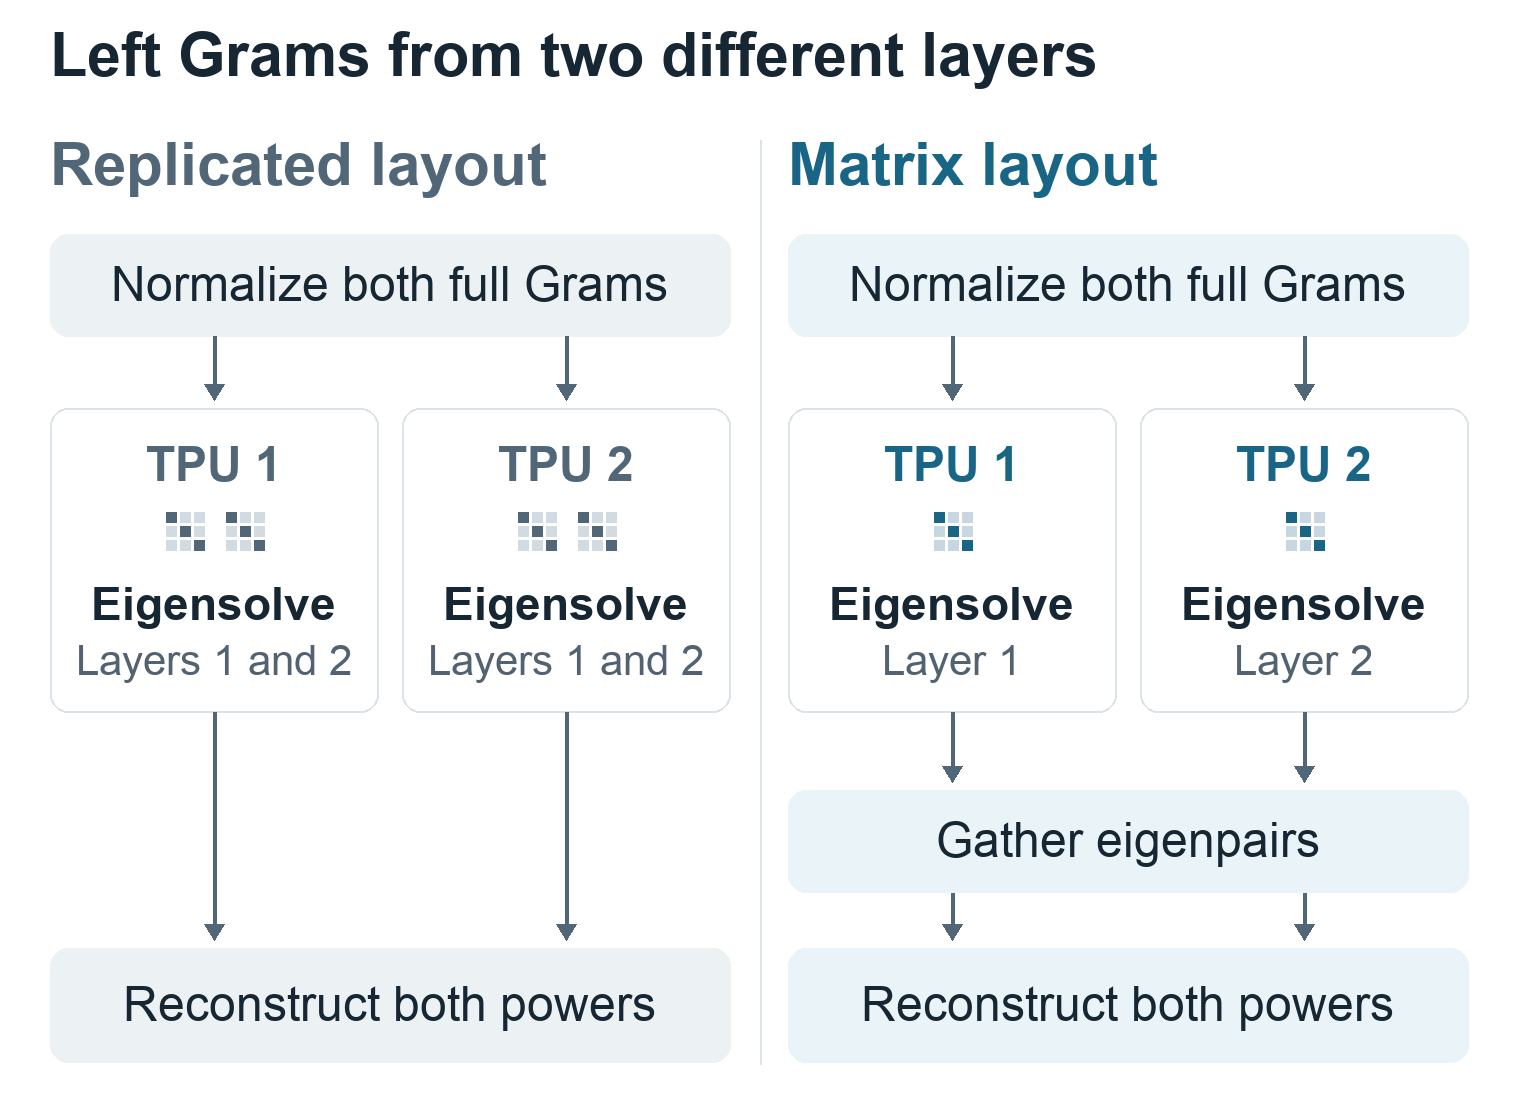
The two matrices are the left Grams of layers 1 and 2. Both layouts replicate normalization and reconstruction.
Results
In a saved-state optimizer diagnostic, switching layouts changed the update directions even with the same Grams and momentum. The relative Frobenius differences ranged from 0.56% to 0.66%. We used the training prefix as a regression check for the new setup, pairing training losses at each update and comparing held-out losses at the one evaluation the runs shared.
The matrix run started from scratch and stopped after 924 updates on the original 7,630-update learning-rate schedule. Both runs used the same configured data mixture, model, precision, and optimizer hyperparameters, seed 0 for initialization and data order, and a global batch of eight sequences of 4,096 tokens. Byte-for-byte identity of the initial weights and cached data remains unverified.
Over training step labels 800–899, the observed mean was 38.75 seconds per update with replication and 3.70 with matrix sharding, a 10.47× difference between the two deployments. The training compilations we observed in the matrix run preceded this window. The warmup status of the historical run could not be verified.
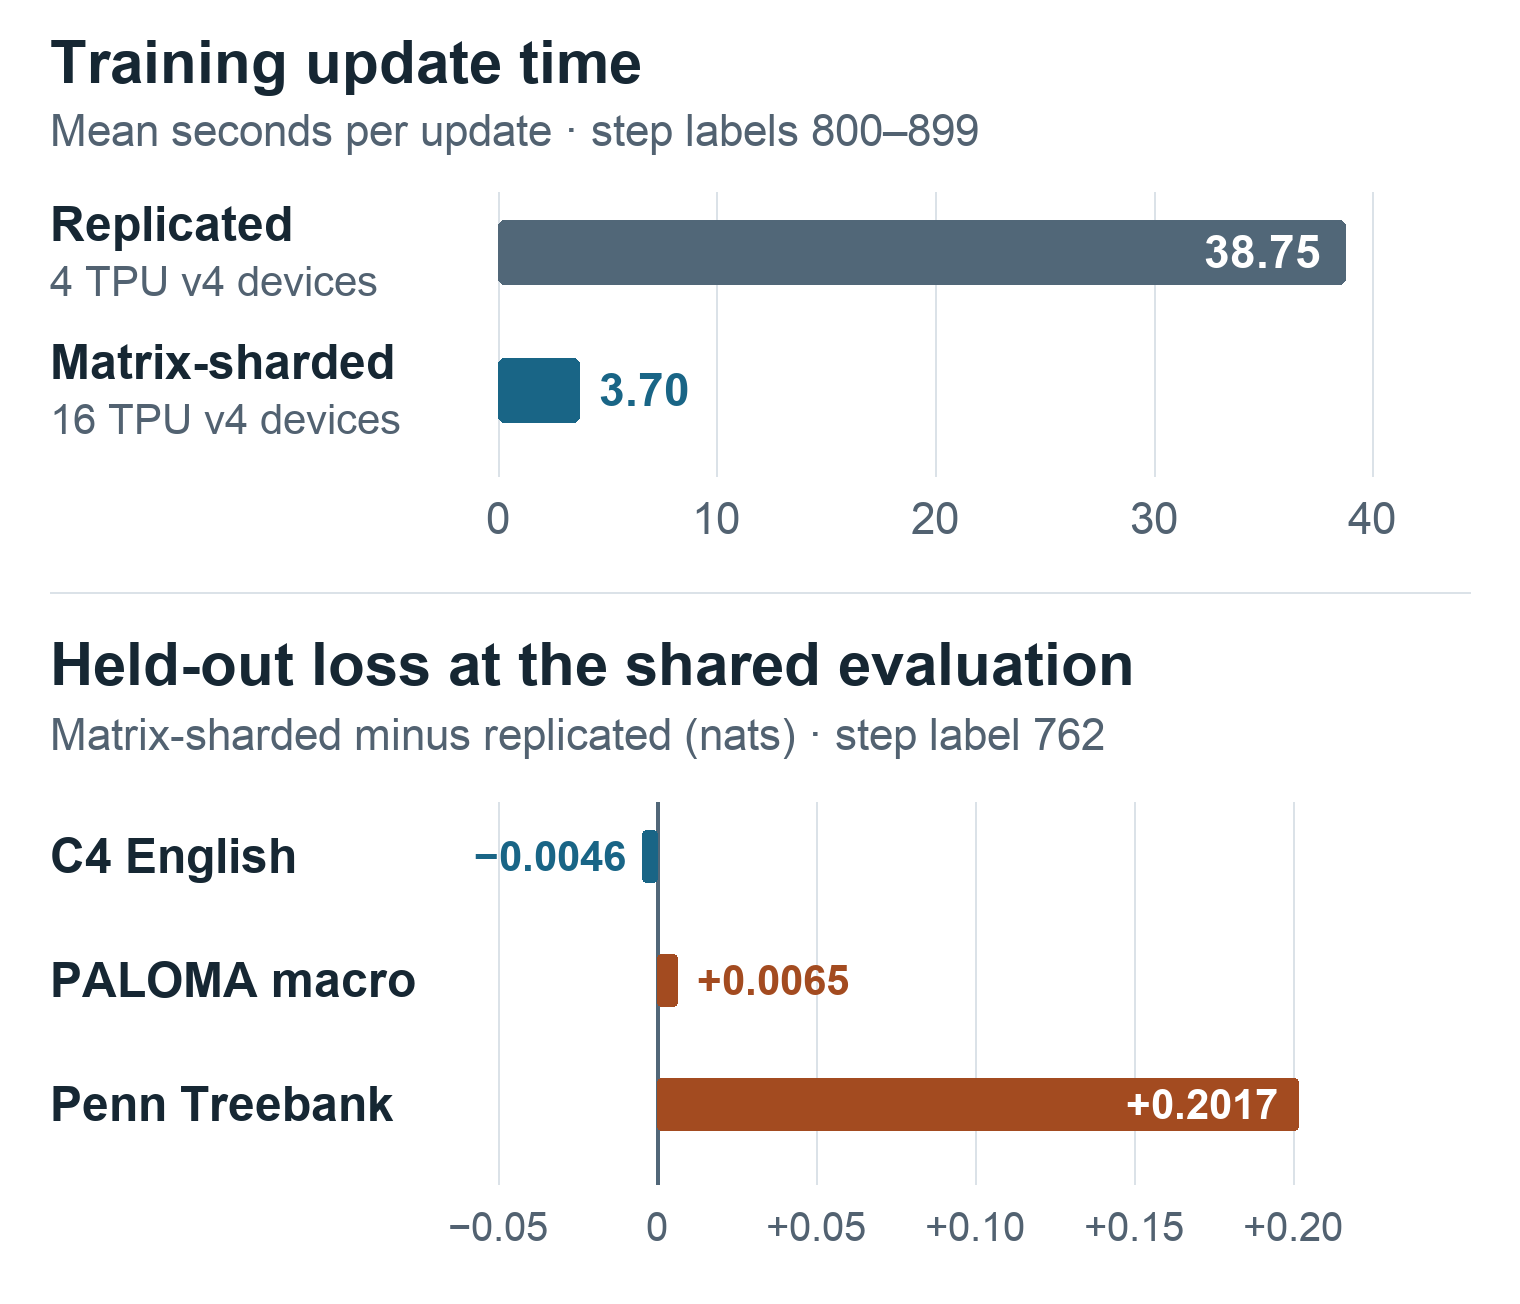
Timing means cover 100 logged updates per run. Validation differences come from the single shared evaluation at step label 762. Timing window and full loss breakdown.
At that evaluation, C4 English loss moved from 5.6753 to 5.6707 nats. Macro loss across the Paloma benchmark rose by 0.0065 nats, and loss on its Penn Treebank subset rose from 7.4611 to 7.6628 nats. Across the 924 matched training losses, sharded minus replicated loss averaged −0.0008 nats. The largest absolute gap was 0.0898 nats. Loss agreement over the full schedule and across seeds remains untested.